Advanced pricing analytics
Analyse market prices through historical trends, competitor comparison, average prices and price positioning — so pricing decisions are made on evidence rather than on the one competitor someone happened to check.
Platform
Platform overview SaaS Dashboard One-click benchmarking How the data worksOur products
KLIKER 4P KLIKER Digital Content KLIKER TelcoReporting & API
Automated reporting Live Excel reports KLIKER API KLIKER MCPSolutions
Price monitoring Promotion monitoring Digital shelf analytics Product content & PDP benchmarking Assortment & market changes Automated e-commerce reportingWho it's for
Brands Retailers Distributors TelcosResources
Plans & add-ons FAQ Glossary Insights CompanySee KLIKER
Take a product tourAccount
KLIKER Market log in KLIKER Telco log in Book a demoCore product
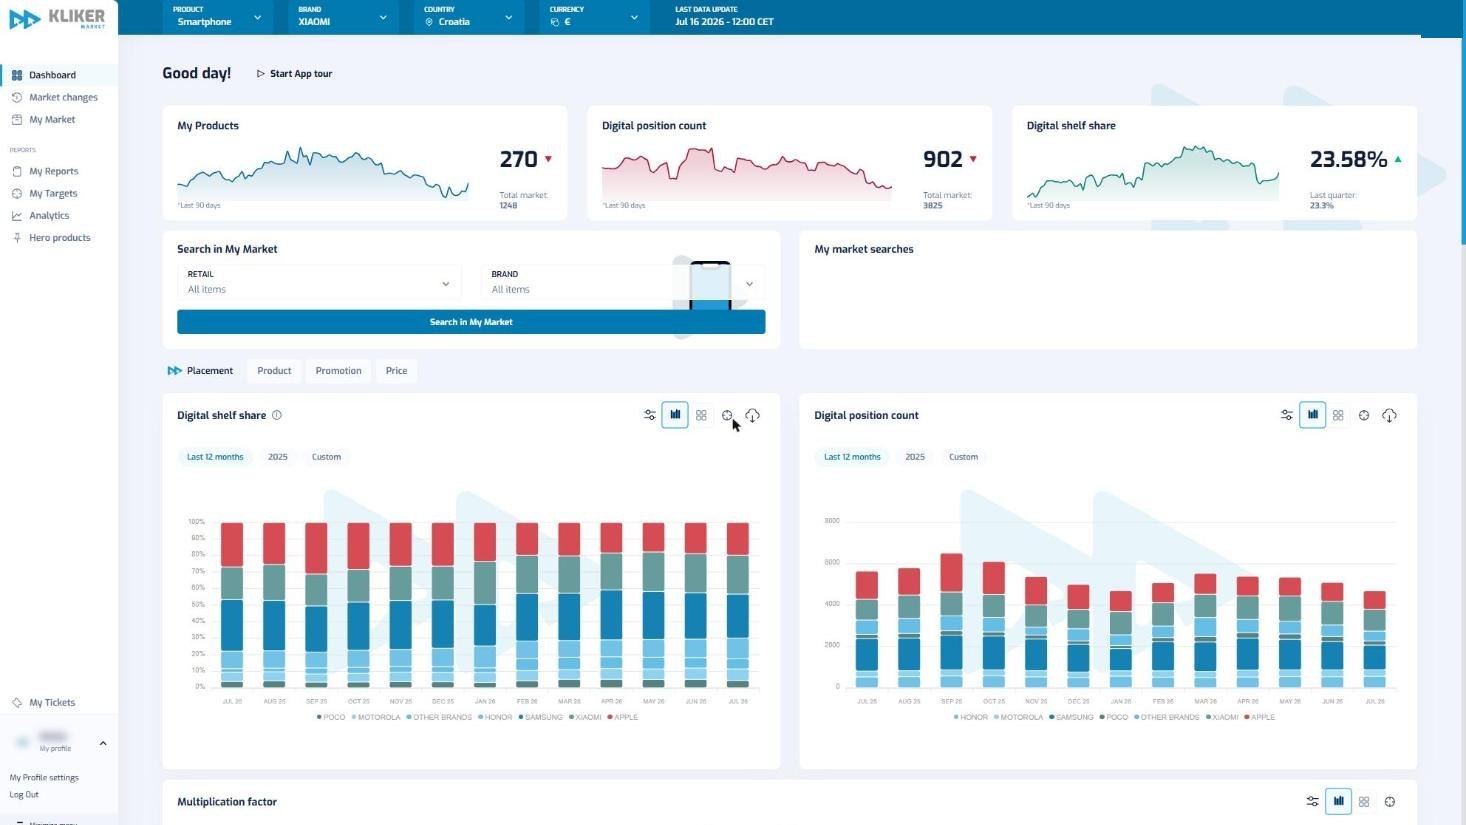
The KLIKER SaaS Dashboard puts the whole online market on one screen — products, prices, promotions, availability and competitors — without opening a single retailer website.
The dashboard is a decision-support tool, not a report viewer. It answers four questions on demand: where am I priced, what changed, what is the competition doing, and where am I losing the shelf. Every view is filterable, drillable and exportable, and any view you rebuild every week can be turned into a scheduled report or a live Excel workbook.
One comparable view of the whole monitored market — products, prices, promotional activity, availability and competitors — instead of dozens of open browser tabs.
Analyse market prices through historical trends, competitor comparison, average prices and price positioning — so pricing decisions are made on evidence rather than on the one competitor someone happened to check.
Follow every promotion running on the monitored market, compare competitor promotional activity, and identify where a promotional window is an opportunity — or a risk to your price positioning.
Continuously track what competitors change: new products, price moves, availability shifts and promotional campaigns — without anyone manually re-checking a list of websites.
Analyse your portfolio by brand, category and retailer, and compare market coverage and range width against the competitive set.
Define your own KPIs and business goals, then track achievement through personalised metrics and notifications instead of a manual scorecard.
Advanced filtering and drill-down by retailer, brand, category, product or time period, so a question that used to take an afternoon takes a few clicks.
How a KPI becomes a decision
A KPI on its own is decoration. These are the four the dashboard is built around, and what each one is actually for.
Are we priced competitively against the market?
Competitive price index, price position against market min / average / max, and where the best market price sits.
Identify SKUs outside the target range and investigate whether pricing, retailer behaviour or a supplier negotiation needs to change.
Is a competitor increasing promotional pressure in our category?
Promotion share, mechanics, depth and duration across the monitored market, with the overlap against your own calendar.
Re-time or re-size the next campaign, or decide deliberately not to respond — with the competitor’s actual pattern on the table.
Where are we unbuyable right now, and for how long have we been?
Availability per retailer over time, plus replenishment speed after a stock-out.
Raise the specific retailer and SKU with the account manager, with the duration attached rather than an impression.
Is a meaningful part of the market’s range missing from ours?
Listing coverage by retailer, range width against the competitive set, and the price points and specifications where you are absent.
Prioritise the range review, or take the gap into the next listing conversation with the retailer.
Reporting & export
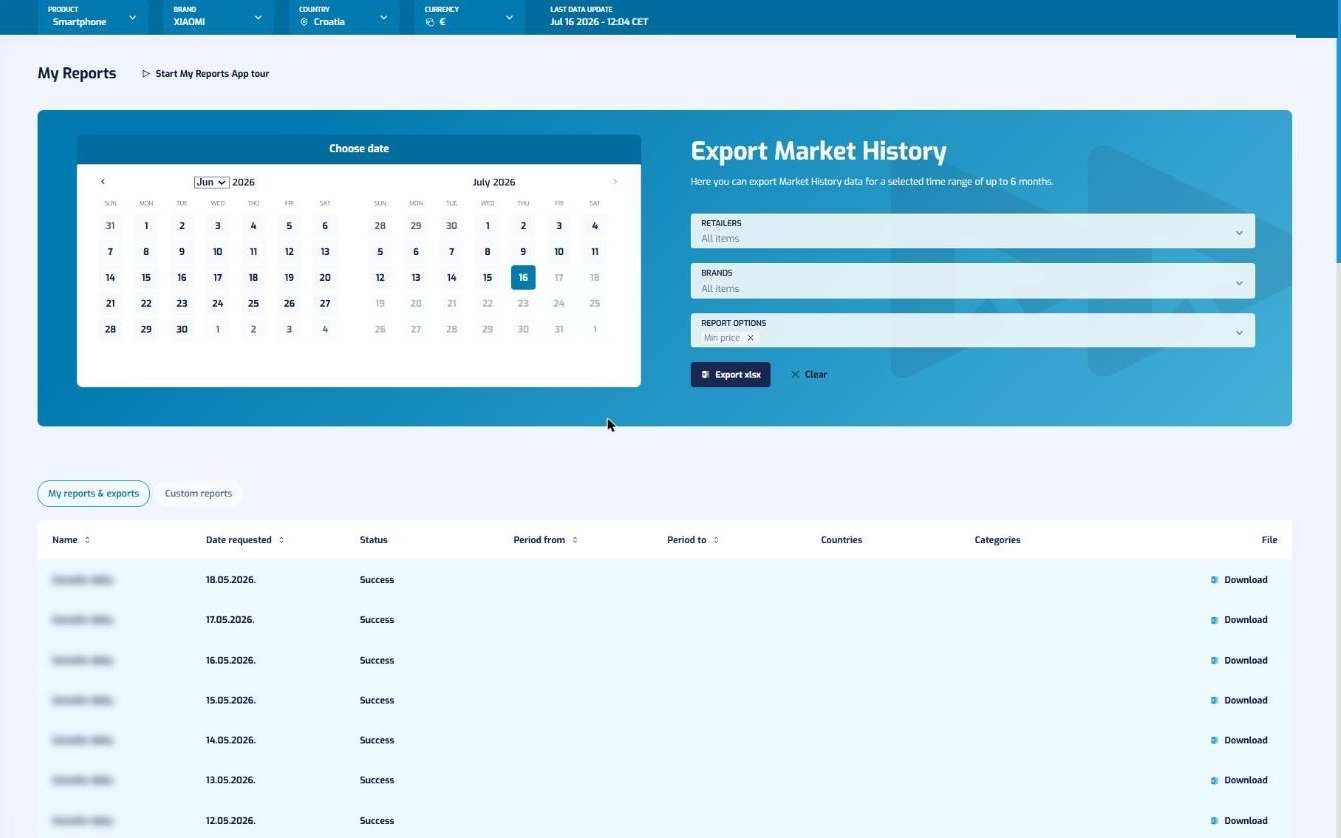
Create and export reports in Excel, PDF and other formats, or hand the recurring ones to automated distribution — daily, weekly or on your own schedule.
Modules
Questions
Category managers, pricing analysts, trade marketing, e-commerce managers, key account managers and commercial leadership. It is designed as an everyday operational tool rather than a quarterly analytics exercise.
The platform is built so that a short training session covers most day-to-day work. Filtering, benchmarking and exporting follow the same pattern across modules.
Yes. Custom KPIs and target tracking exist so the platform reflects how your team measures the market, rather than forcing a generic metric set. Deeper structural customisation is handled through custom reports.
Yes. Benchmarking supports comparison by technical specification, not only by product name, so you compare genuinely comparable models across retailers and brands. See one-click benchmarking.
We will load your categories and your competitive set so you see your shelf, not a generic demo dataset.
See the platform immediately through an interactive AI-guided experience. No form, no meeting.
Explore KLIKER with AITalk to our team about your markets, competitors and specific business requirements. Free trial available after the demo.
Book a demo